EASA-Certified
·
500+ Projects
·
2-Day Turnaround
RADIOMETRIC THERMOGRAPHY

Drone Thermal Imaging Surveys Ireland

Radiometric thermal surveys for heat loss detection, moisture ingress analysis, and equipment fault finding. Temperature-calibrated data with precise defect location mapping – covering large areas rapidly from the air. The Irish thermal survey season runs September to March, when indoor-outdoor temperature differentials are strongest.

Thermal survey pricing from €500

Last updated: April 2026

Radiometric Data
Temperature Mapping
EASA Certified
THERMAL SCAN ACTIVE
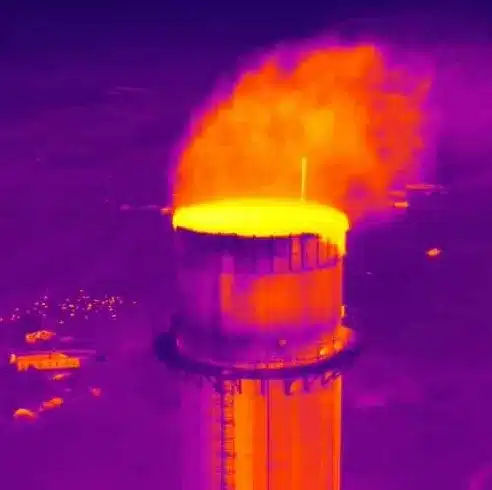
Drone thermal imaging inspection of industrial chimney, Ireland
EASA & IAA
Certified Operators
€13M
Public Liability Insurance
500+
Projects Nationwide
Since 2016
one of Ireland’s longest-established
0.05°C
Thermal Sensitivity

Key Deliverables

Every thermal imaging survey includes radiometric data with temperature-calibrated analysis and actionable recommendations.

Radiometric Thermal Maps

Georeferenced thermal orthomosaics with embedded temperature data at every pixel for precise analysis and measurement.

Temperature Differential Reports

Detailed analysis of temperature variations across surfaces identifying anomalies, hotspots, and cold spots with severity ratings.

Moisture Ingress Analysis

Identification of moisture-affected areas using thermal differential patterns, revealing hidden leaks and water damage paths.

Heat Loss Assessment

Building envelope thermal performance analysis showing areas of excessive heat loss through walls, roofs, windows, and junctions.

Defect Location Overlay

Thermal anomalies overlaid on visual imagery and site plans with precise GPS coordinates for easy defect location on-site.

Remediation Recommendations

Prioritised remediation recommendations based on defect severity, potential impact, and estimated cost-benefit of repair.

See What the Eye Can’t with Aerial Thermal Imaging

Send us the property details or site location. We’ll respond with a fixed-price quote within 24 hours – including all thermal analysis and reporting.

0.05°C
Thermal Sensitivity
1–2 Days
Report Turnaround
10x
Faster Than Ground Surveys
500+
Surveys Completed

How Aerial Thermal Imaging Works

Not just a heat camera on a drone. The sensor, the timing, and the conditions all determine whether you get useful data or expensive wallpaper.

01

Radiometric Capture

We fly the DJI Zenmuse H20T – a multi-sensor payload with a radiometric thermal camera alongside visible-light lenses – or the C2-classified DJI Mavic 3 Thermal (M3T), a much smaller and lighter aircraft that captures the same resolution radiometric thermal data. Radiometric means every pixel contains an actual temperature value (e.g. 14.2°C), not just a colour on a gradient. That is the difference between a picture and data you can act on.

02

Optimal Timing

For building energy surveys we fly early morning – ideally before sunrise. The building has cooled overnight but the heating system has been running, so heat escaping through defects shows up clearly against the cold exterior. Fly the same building at midday in summer and solar gain masks every genuine defect. We decline surveys when conditions are wrong.

03

Systematic Flight Plan

We plan the flight to achieve consistent angle and distance coverage across all surfaces – roof, facades, junctions, and penetrations. Thermal data is captured simultaneously with high-resolution RGB imagery so every anomaly can be pinpointed on a visible-light reference image.

04

Annotated Defect Report

Deliverables include a georeferenced thermal orthomap, annotated defect catalogue with temperature readings at each anomaly, severity classification, and a plain-language remediation summary. Irish weather – cool, overcast, mild – gives excellent thermal contrast. We get better results here than operators in warmer climates.

What Thermal Can and Cannot Detect

Every few months someone expects a thermal survey to find everything wrong with a building. It will not. Here is what it actually does.

Thermal Can Detect

  • Heat loss through walls and roof sections – missing or failed insulation shows up immediately
  • Moisture trapped under flat roof membranes (wet insulation retains heat differently)
  • Underfloor heating leaks and pipe runs
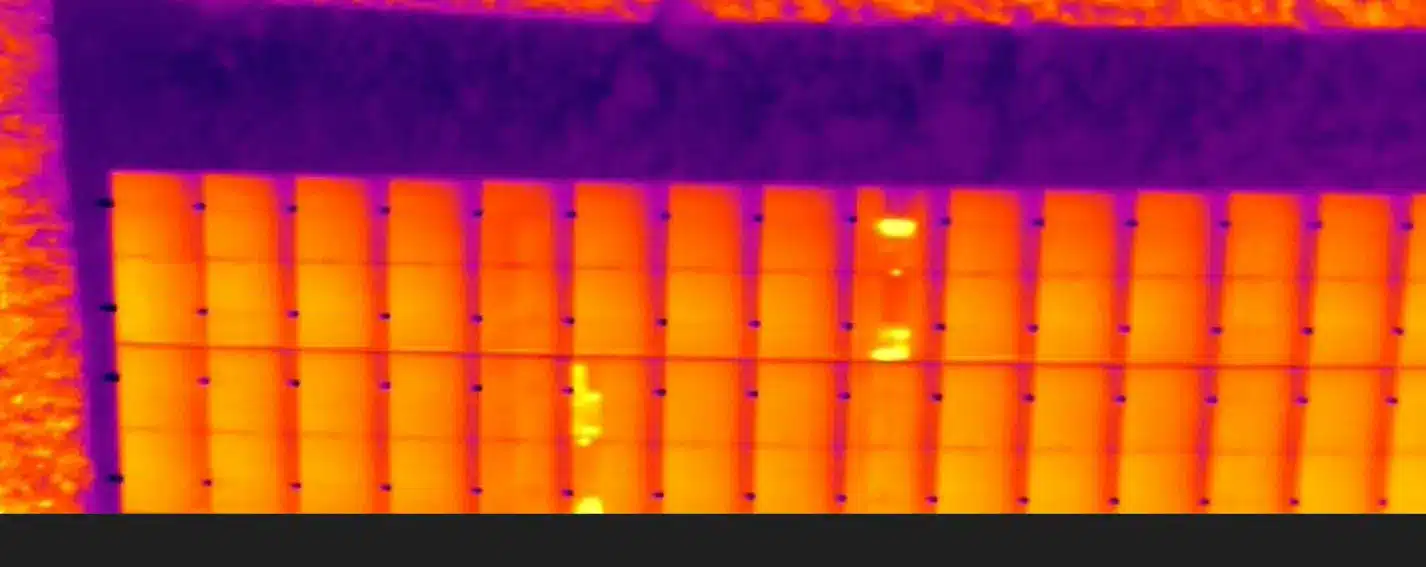
  • Electrical hotspots on solar panel arrays
  • Air leakage paths around windows, doors, and junctions
  • Blocked or failing drainage (shows as cold spots in the ground)

Thermal Cannot

  • Diagnose root cause – thermal shows the symptom, not the reason. Follow-up investigation is needed.
  • Detect deep structural issues – it reads surface temperature only, not through 300mm of blockwork
  • Work without a temperature differential – if the exterior matches the interior, the camera has nothing to see
  • Replace a blower door test for air-tightness certification

Aerial Thermal vs Handheld Survey

Both tools have their place. Here is where aerial wins.

Drone Thermal (DSI) Handheld Thermographer
Large flat roof (>1,000m²)20–40 minutes, complete coverageHours of scaffolding or hatch access
High facade above 5mFull coverage from the airRequires MEWP or scaffold
Georeferenced defect mappingIncluded as standardManual annotation, limited precision
Consistent angle and distanceAutomated flight planVaries with technician and access
Simultaneous RGB overlayYes – H20T / M3T dual sensorRequires a second camera
Best forRoofs, facades, estates, solar arraysInterior walls, floor heating, tight spaces

A thermal survey done in July at midday is nearly useless for building diagnostics. We say this because other operators will happily take your money regardless of conditions. Timing matters more than the equipment specification.

Who Uses Drone Thermal Imaging?

Our thermal imaging data supports building professionals, energy assessors, and asset managers across Ireland.

Building Envelope Assessment

Solar Panel Inspection

Flat Roof Moisture Detection

Electrical Infrastructure

Energy Performance

District Heating Networks

Industrial Facilities

Insurance Surveys

Thermal Drone Surveys and Inspections: What We Cover

A thermal drone survey and a thermal drone inspection describe the same flight. What differs is the asset, and what a temperature difference means once you are looking at it.

  • Building envelope and heat loss. Radiometric capture across facades and flat roofs shows where heat is escaping and where insulation has failed or been missed. Envelope surveys read best in the cooler months, early morning or evening, when the temperature difference between a heated interior and the outside air is greatest.
  • Electrical and industrial assets. Aerial thermal imaging services identify hotspots on electrical infrastructure and plant, where a rising temperature is often the first sign of a developing fault. Every anomaly is reported with a true temperature value rather than a colour impression.
  • Moisture and water ingress. Wet areas cool at a different rate to dry ones, so trapped moisture shows up beneath roof membranes, inside wall cavities and within insulation long before it becomes visible. For a full building and roof condition report, see our drone roof inspection service.
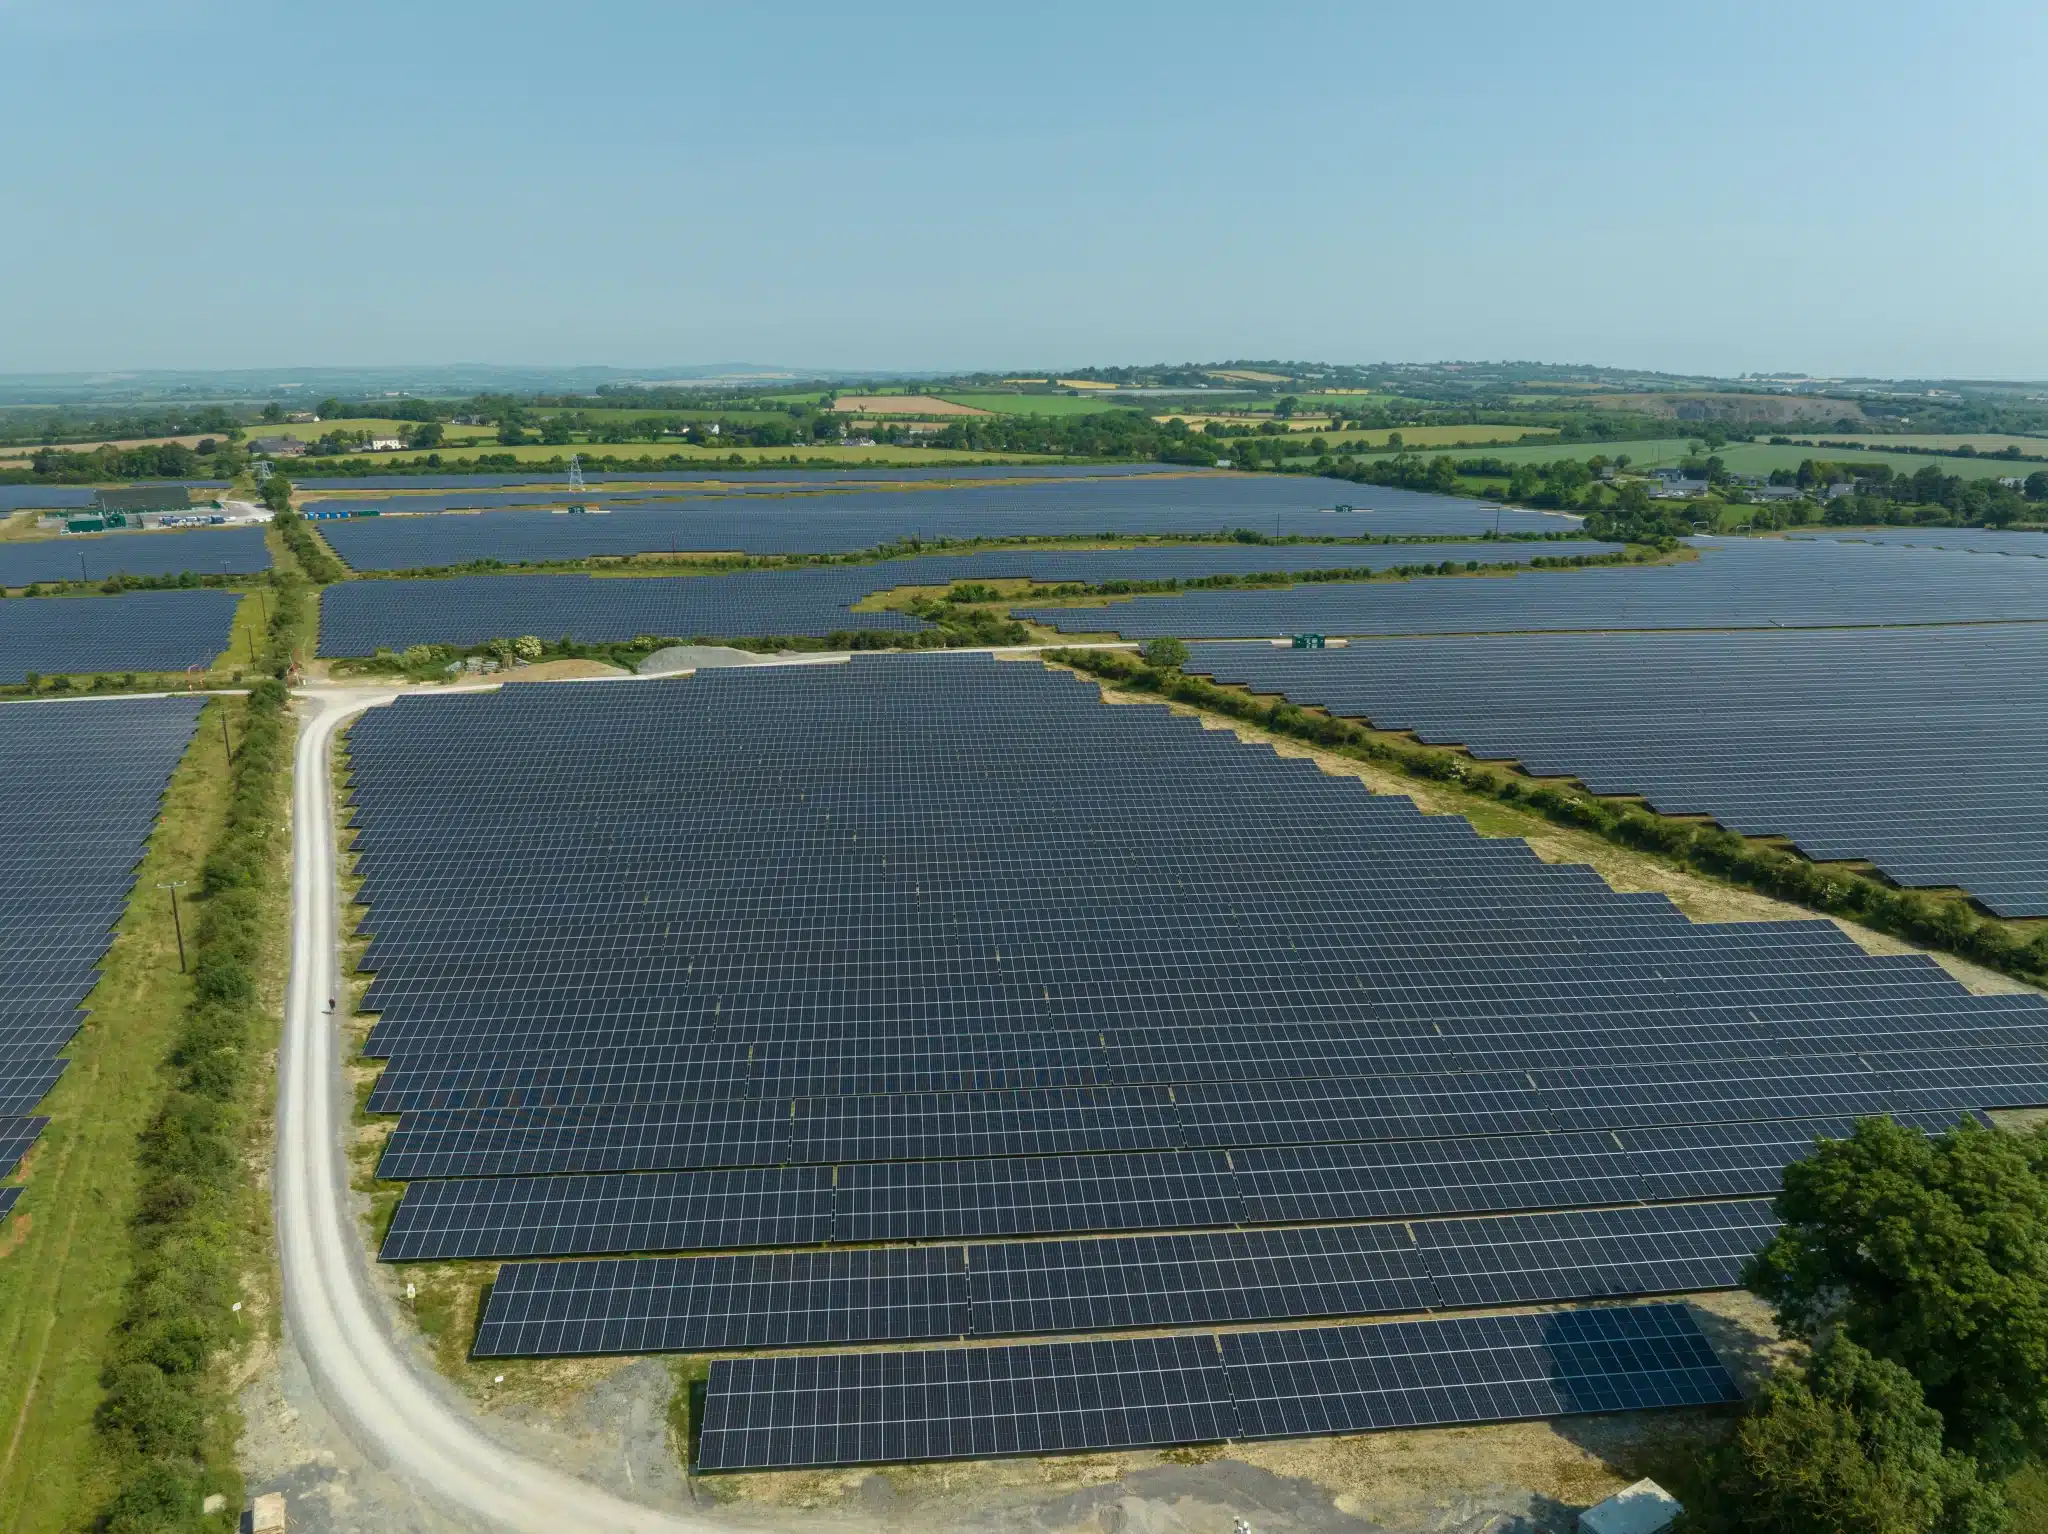
  • Solar arrays. Photovoltaic faults have their own flight rules and reporting format, so we run those as a dedicated solar panel inspection rather than as part of a general thermal survey.

Coverage runs from a single building to industrial complexes and sites of 50+ acres in a single day, and we capture thermal and visual imagery on the same flight so every anomaly has a matching photograph. Quotes are fixed price, based on property size and survey scope.

Fleet Note: The Mavic 3 Thermal

In 2026 we added the DJI Mavic 3 Thermal (M3T) to the fleet alongside the M300 RTK and Zenmuse H20T. The M3T is a C2-classified aircraft, much smaller and lighter than the M300, which makes it quicker to deploy and simpler to operate compliantly near people and buildings – while capturing the same resolution radiometric thermal data. For many building, roof and solar thermal jobs it is the faster aircraft to mobilise.

Frequently Asked Questions

Everything you need to know about our drone thermal imaging service.

Radiometric thermal imaging captures true temperature values at every pixel in the image, not just relative colour differences. This means each pixel contains a precise temperature measurement that can be analysed, compared, and used for engineering-grade assessments.
For heat loss surveys, early morning or evening during cooler months provides the best thermal contrast between heated interiors and cold exteriors. For solar panel inspections, midday under clear skies is ideal. We schedule each survey at the optimal time for your specific application.
Yes. Moisture-affected areas cool at different rates to dry areas, creating detectable temperature differentials. Our radiometric cameras can identify moisture trapped beneath roof membranes, within wall cavities, and in insulation – damage that is invisible to the naked eye.
Drone thermal imaging can cover areas from a single building to large industrial complexes and solar farms of 50+ acres in a single day. The aerial approach is significantly faster than ground-based thermal surveys, especially for roofs and large facilities.
Visual inspection captures what you can see – surface damage, wear, and visible defects. Thermal imaging reveals hidden issues like moisture ingress, heat loss, electrical faults, and insulation gaps that are invisible to the eye. We typically capture both simultaneously for comprehensive assessment.
We provide fixed-price quotes based on property size and survey requirements. Drone thermal imaging is significantly more cost-effective than ground-based thermography for roofs and large areas. Contact us with your property details for a no-obligation quote.
A standard drone inspection records what the camera can see: cracking, displacement, corrosion, physical damage. A thermal drone survey adds a radiometric sensor that measures a true temperature at every pixel, which reveals moisture ingress, heat loss, insulation gaps and electrical hotspots that look completely normal in a visual image. We usually capture both on the same flight, because a temperature anomaly is far easier to act on when there is a matching photograph of the same spot.
Yes. Aerial thermal imaging is well suited to electrical infrastructure and industrial plant, where a rising temperature is often the earliest sign of a developing fault. Reports are radiometric, so each flagged anomaly carries a measured temperature value and a georeferenced location rather than a colour impression, which is the format asset managers and insurers need for planned maintenance.

Request a 24-Hour Quote

Tell us about your project and we’ll respond within 24 hours with a detailed quote.

Free quote within 24 hours
No obligation, no hidden costs
EASA & IAA certified operators
Or call us now: 087 205 2331

Get a Fixed-Price Quote Within 24 Hours

No obligation, no hidden costs. Tell us about your site and we will come back with a methodology and price.

Fixed pricing, no surprises
We handle all permissions
Deliverables in 2 days
Call Now Get a Quote